VACCAY

Project
Case Study for DASTA Innovation Competition
Duration
May 2021 — September 2021 (16 weeks)
Role
UX Researcher
UX/UI Designer
Tools
Figma
Figjam
Team
Nawamon Chanprapun
Ratchita Sarawanawong
Tanaporn Lawsuriyont
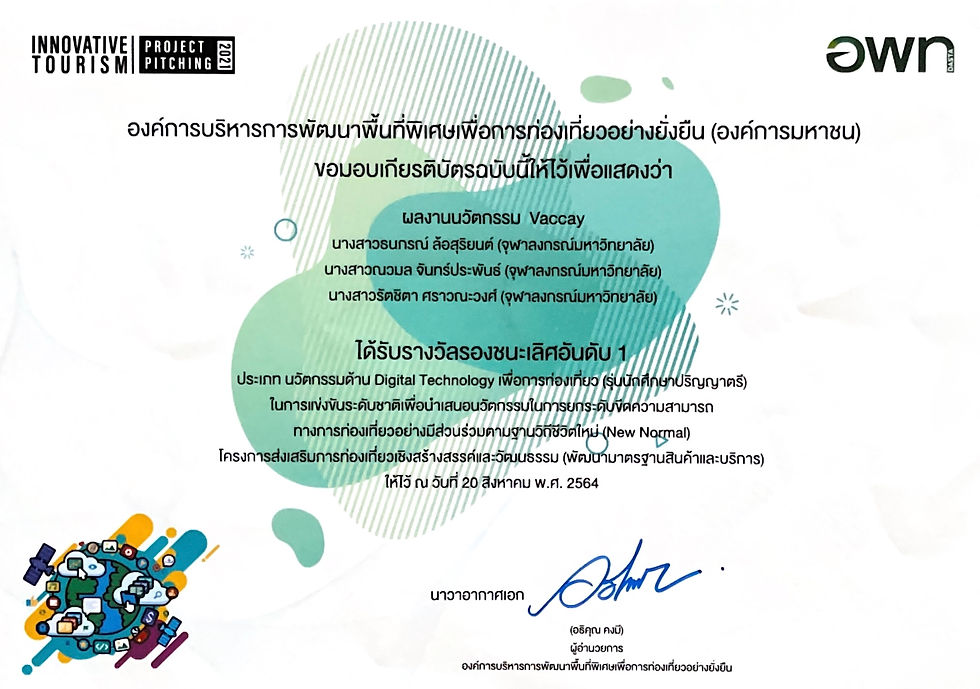
Fine Round
August 2021
First runner-up
Overview
A mobile application was created to submit to The Innovative Tourism Project Pitching 2021 by Sustainable Tourism Administration (DASTA). This travel app will offer real-time crowd density data at Thai tourist spots by tracking wireless device numbers. It will also recommend less crowded alternative locations to enhance the Thai tourist experiences in the post COVID-19 period.
Background
DASTA, also known as the Designated Areas for Sustainable Tourism Administration, is organizing a national competition for the Innovative Tourism Project Pitching 2021. The focus is on redefining travel in the new normal. Participants would select a district and develop a prototype application to help solve these issues. From our personal experience, we chose the designated areas for Andaman tourism.

Problem Issue
In 2019, Thailand’s main income was generated approximately 3 trillion baht from tourism. However, with the onset of Covid-19 towards the end of that year, all businesses, particularly travel, suffered that situation. According to the Thai Hotel Association, 90% of local businesses were forced to close due to the pandemic, leading to unemployment for 50,000 to 60,000 local workers.
Therefore we assumed that people were concerned about the infection in crowded areas, this situation directly made a huge impact on the tourism industry
Secondary Research
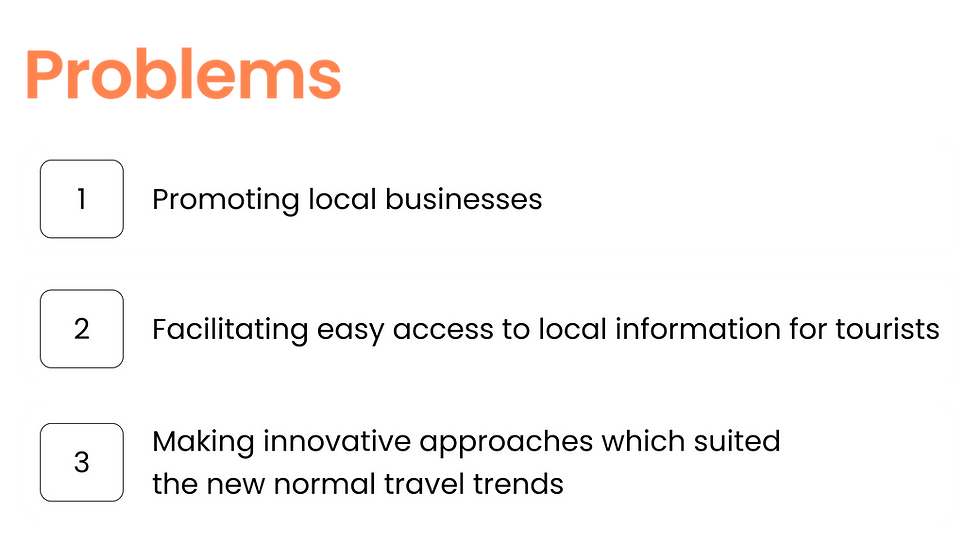
We started to do the research about the effect of COVID-19 on the tourism industry. Then we summarized the main problem issues from our research as
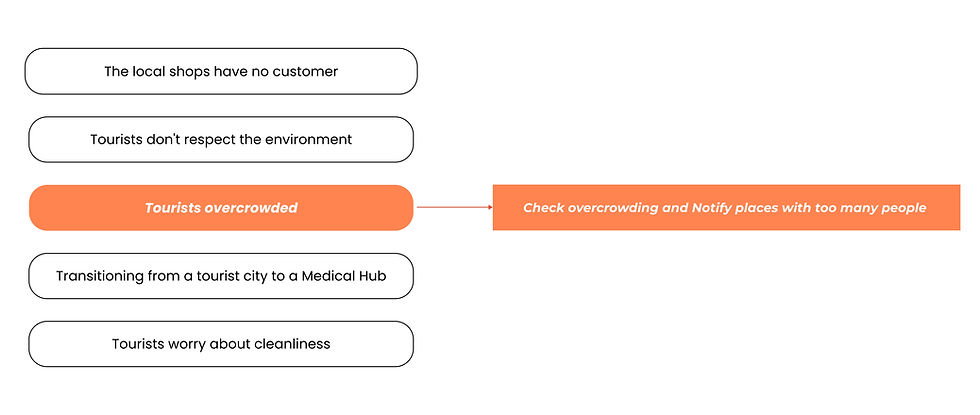
We decided to choose the overcrowded issue as it's the initial concern causing people to be afraid to go outside.
Project Goal
In 2019, Thailand’s main income was generated approximately 3 trillion baht from tourism. However, with the onset of Covid-19 towards the end of that year, all businesses, particularly travel, suffered that situation. According to the Thai Hotel Association, 90% of local businesses were forced to close due to the pandemic, leading to unemployment for 50,000 to 60,000 local workers.
Empathizing
We managed to create an online survey with this scope of questions to get insight information about the user traveling while they had to deal with the crowded situation.
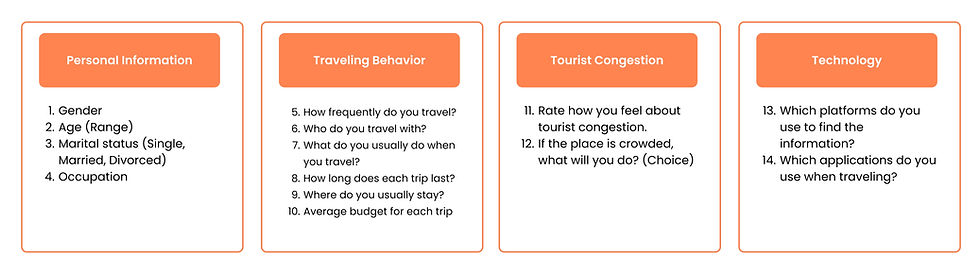
Online Survey
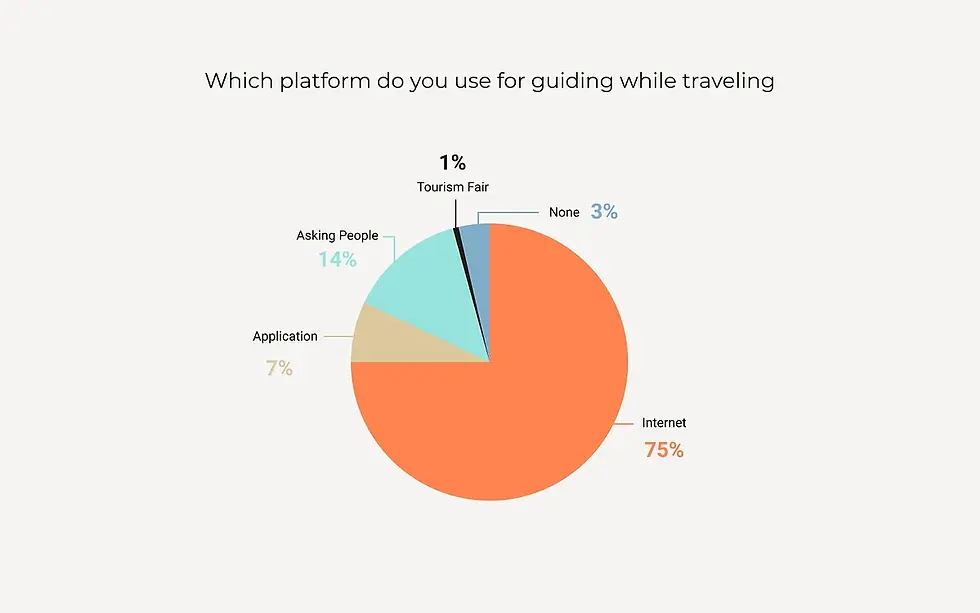
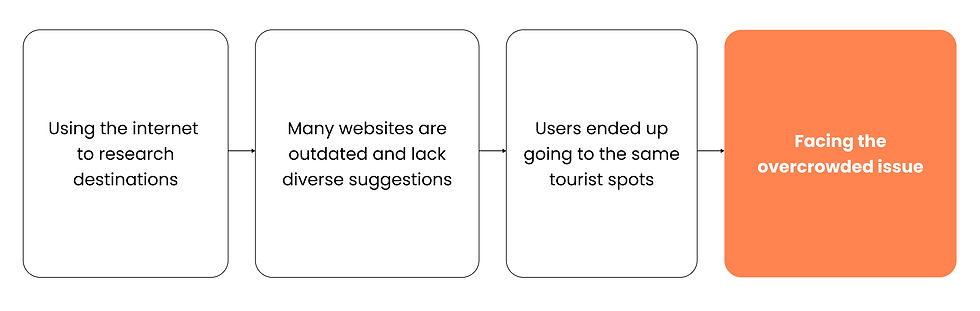
Out of 168 survey participants, our focus was on individuals aged 18–35, as they are typically more adept with technology. Among them, 126 people, or 80%, use the internet to research destinations. (It would be the result of the overcrowded issue) While the advantages are its speed and accessibility, many websites are outdated and lack diverse suggestions. Therefore the users ended up going to the same tourist spots, facing the overcrowded issue.

Competitive Audit
In our research, aside from online sources, we analyzed various travel, booking, and review applications. Many competitors primarily offer features for suggesting locations, reviewing destinations, and making bookings. Google Maps stands out as the only platform that provides information on the crowd density at specific locations.
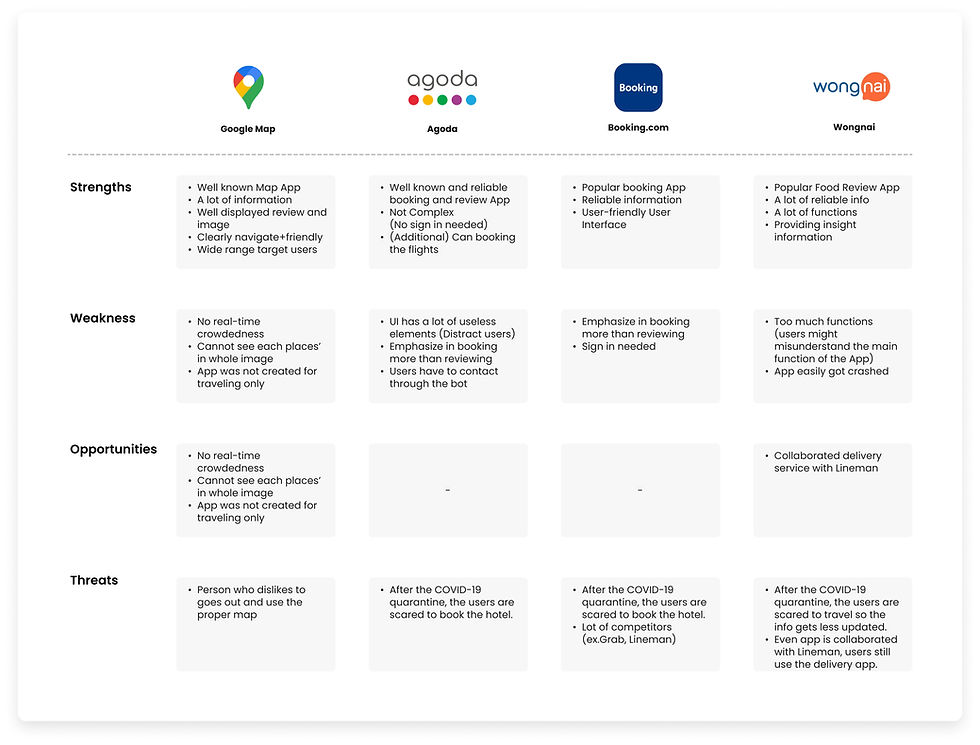
Good Feature
-
The reliable and directed insight reviews from users
-
Containing a crowded display feature
-
Most of them have user-friendly UI
Could be improved
-
Containing a lot of UI useless elements
-
Some have too much function
(Distract user from main features)
Define
Persona
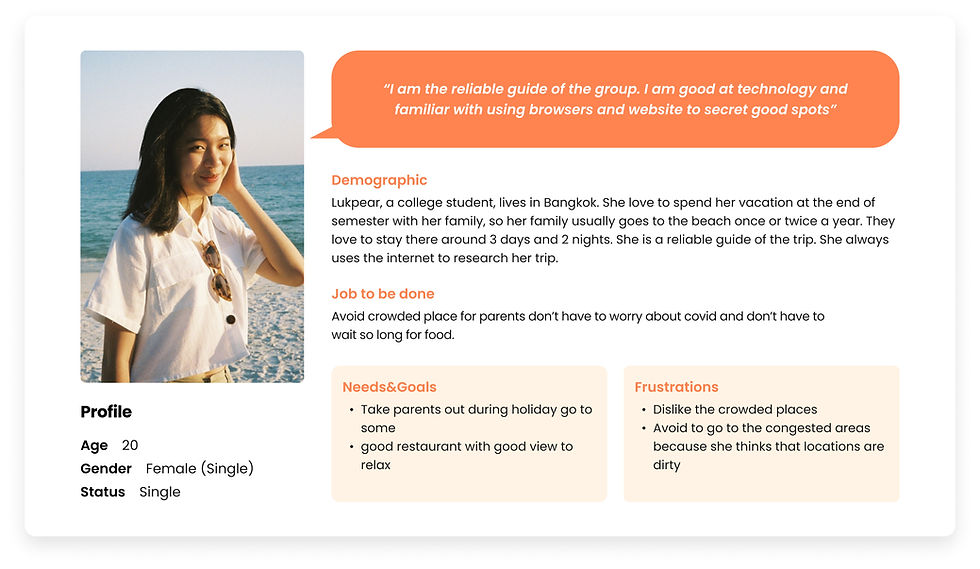
User Journey


As is User Journey map
To be User Journey map

Pain Points
The problem gets repeated like a loop
Problem Statement
How might we reduce tourist congestion. By creating a platform that informs tourists about the current crowd levels, supporting and promoting local tourism businesses in Thailand.
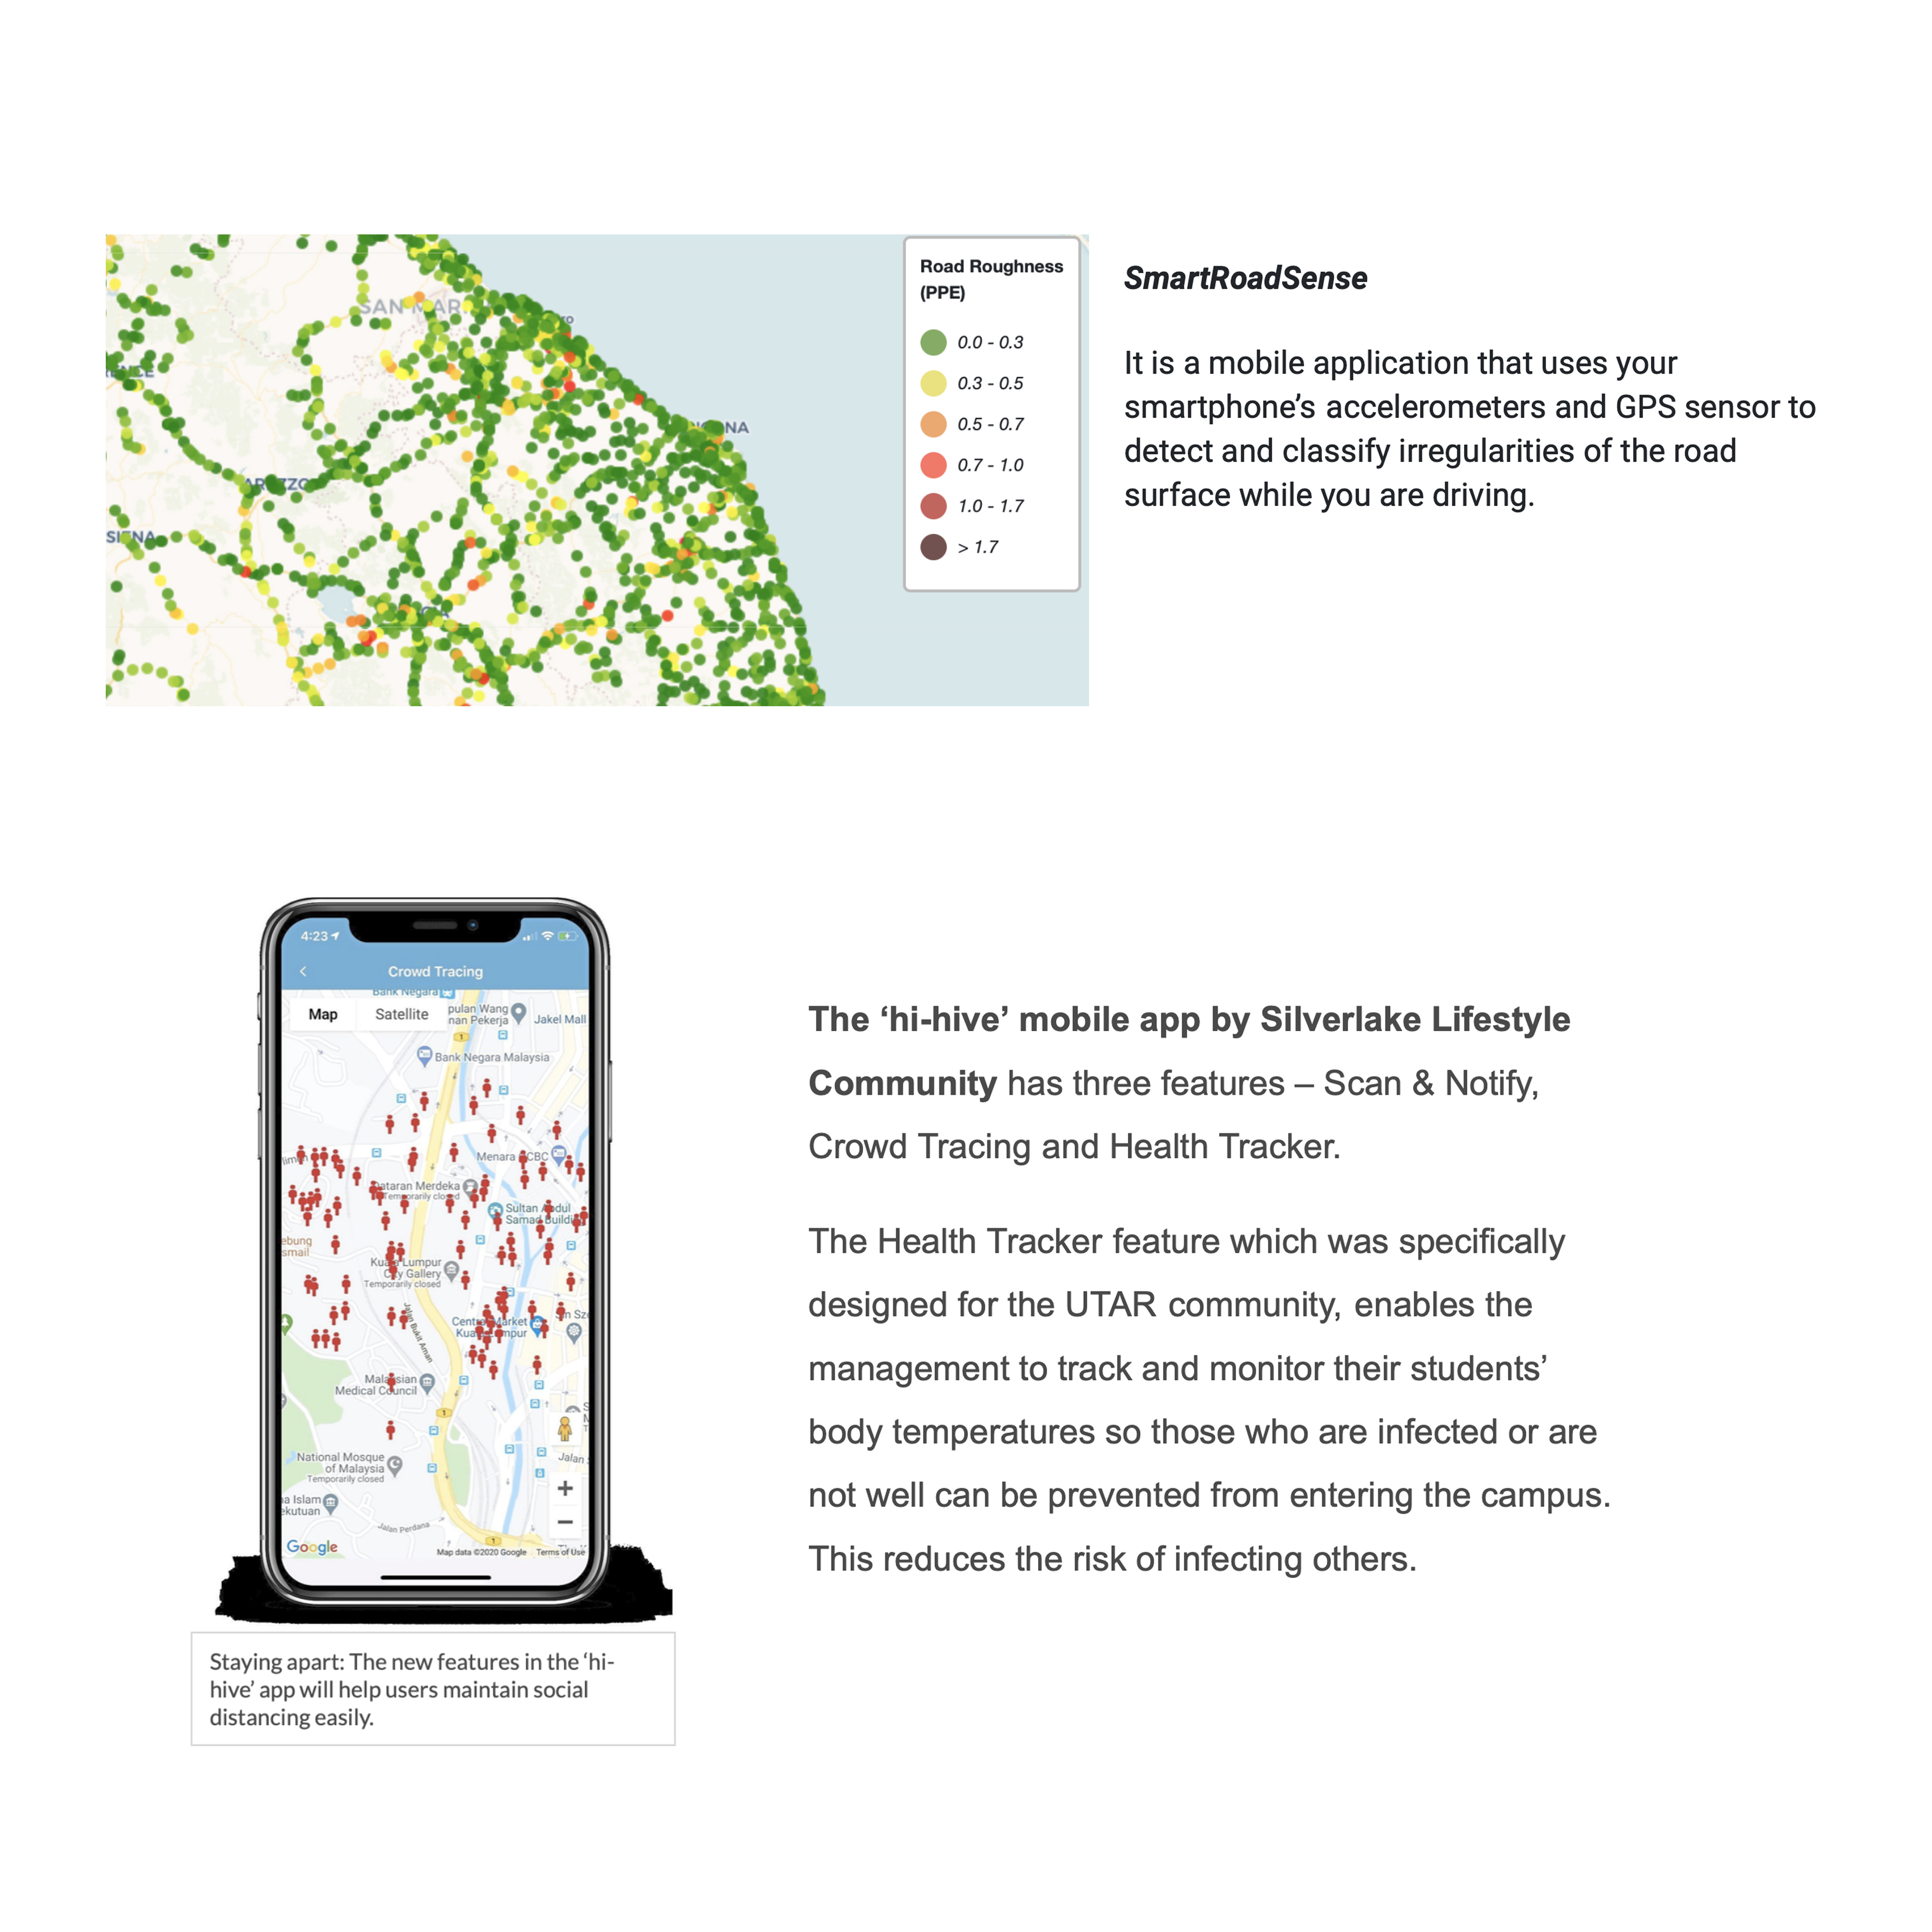
Tracking Crowdedness Feature
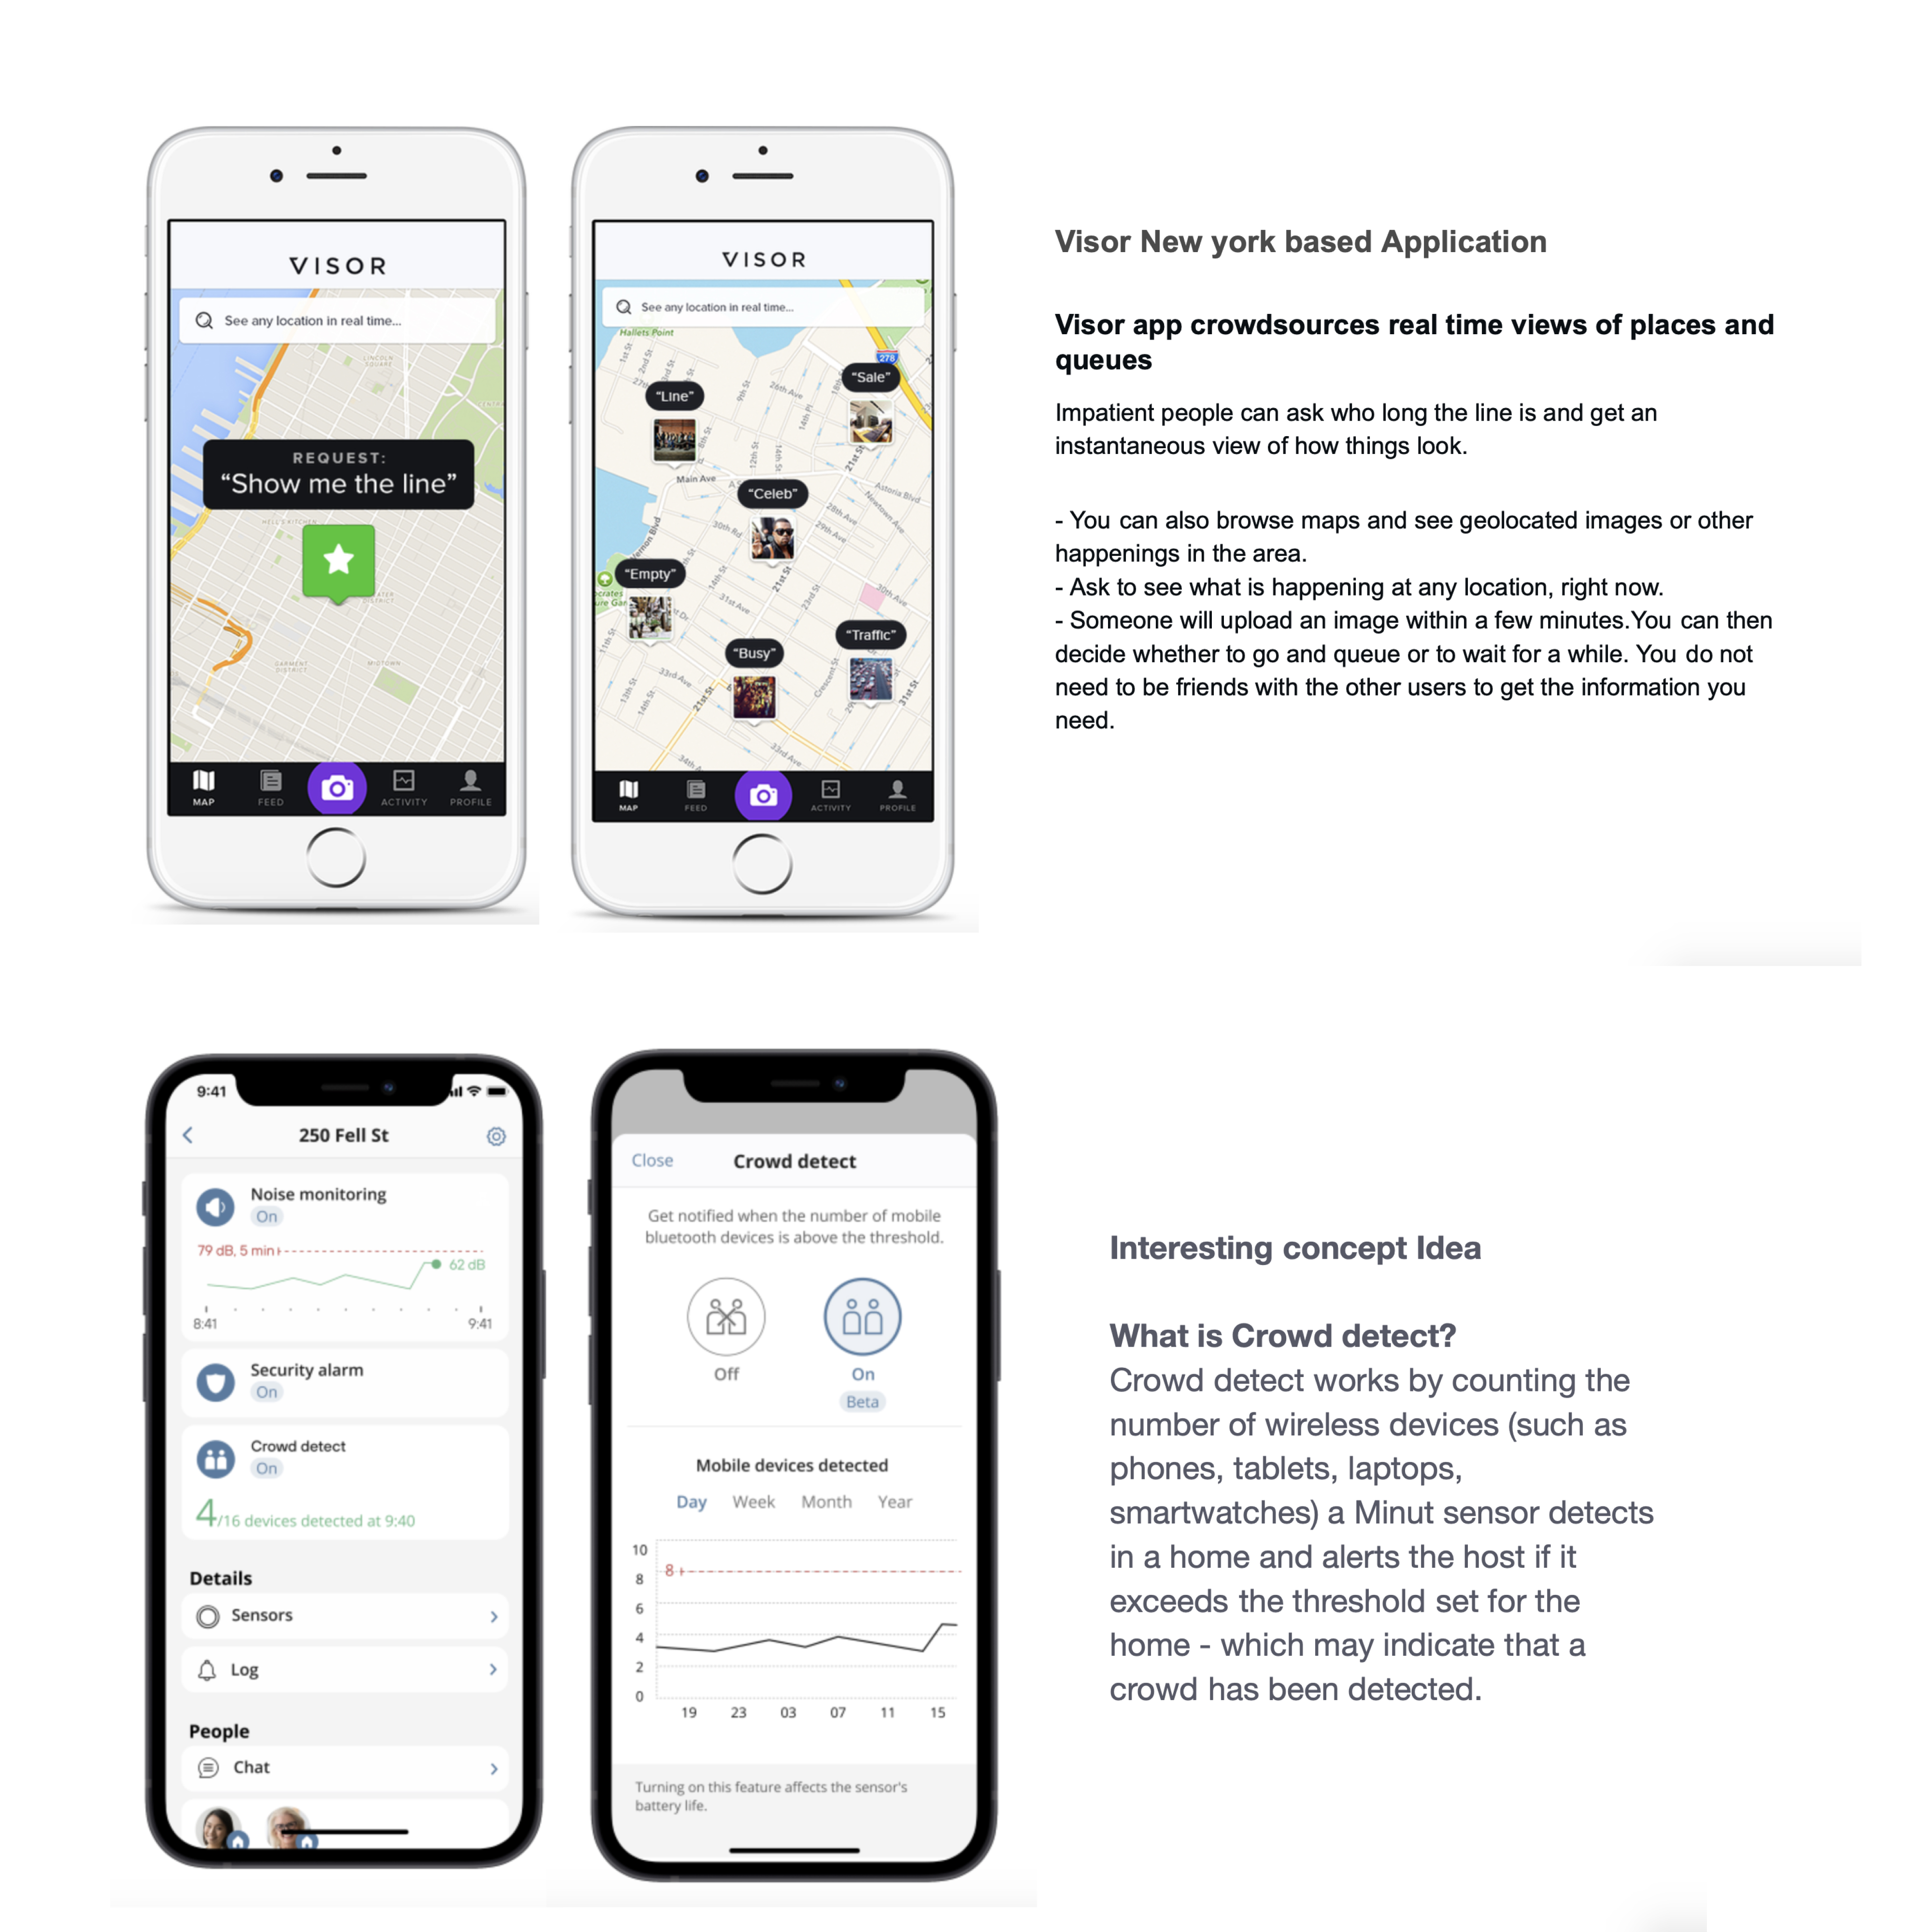
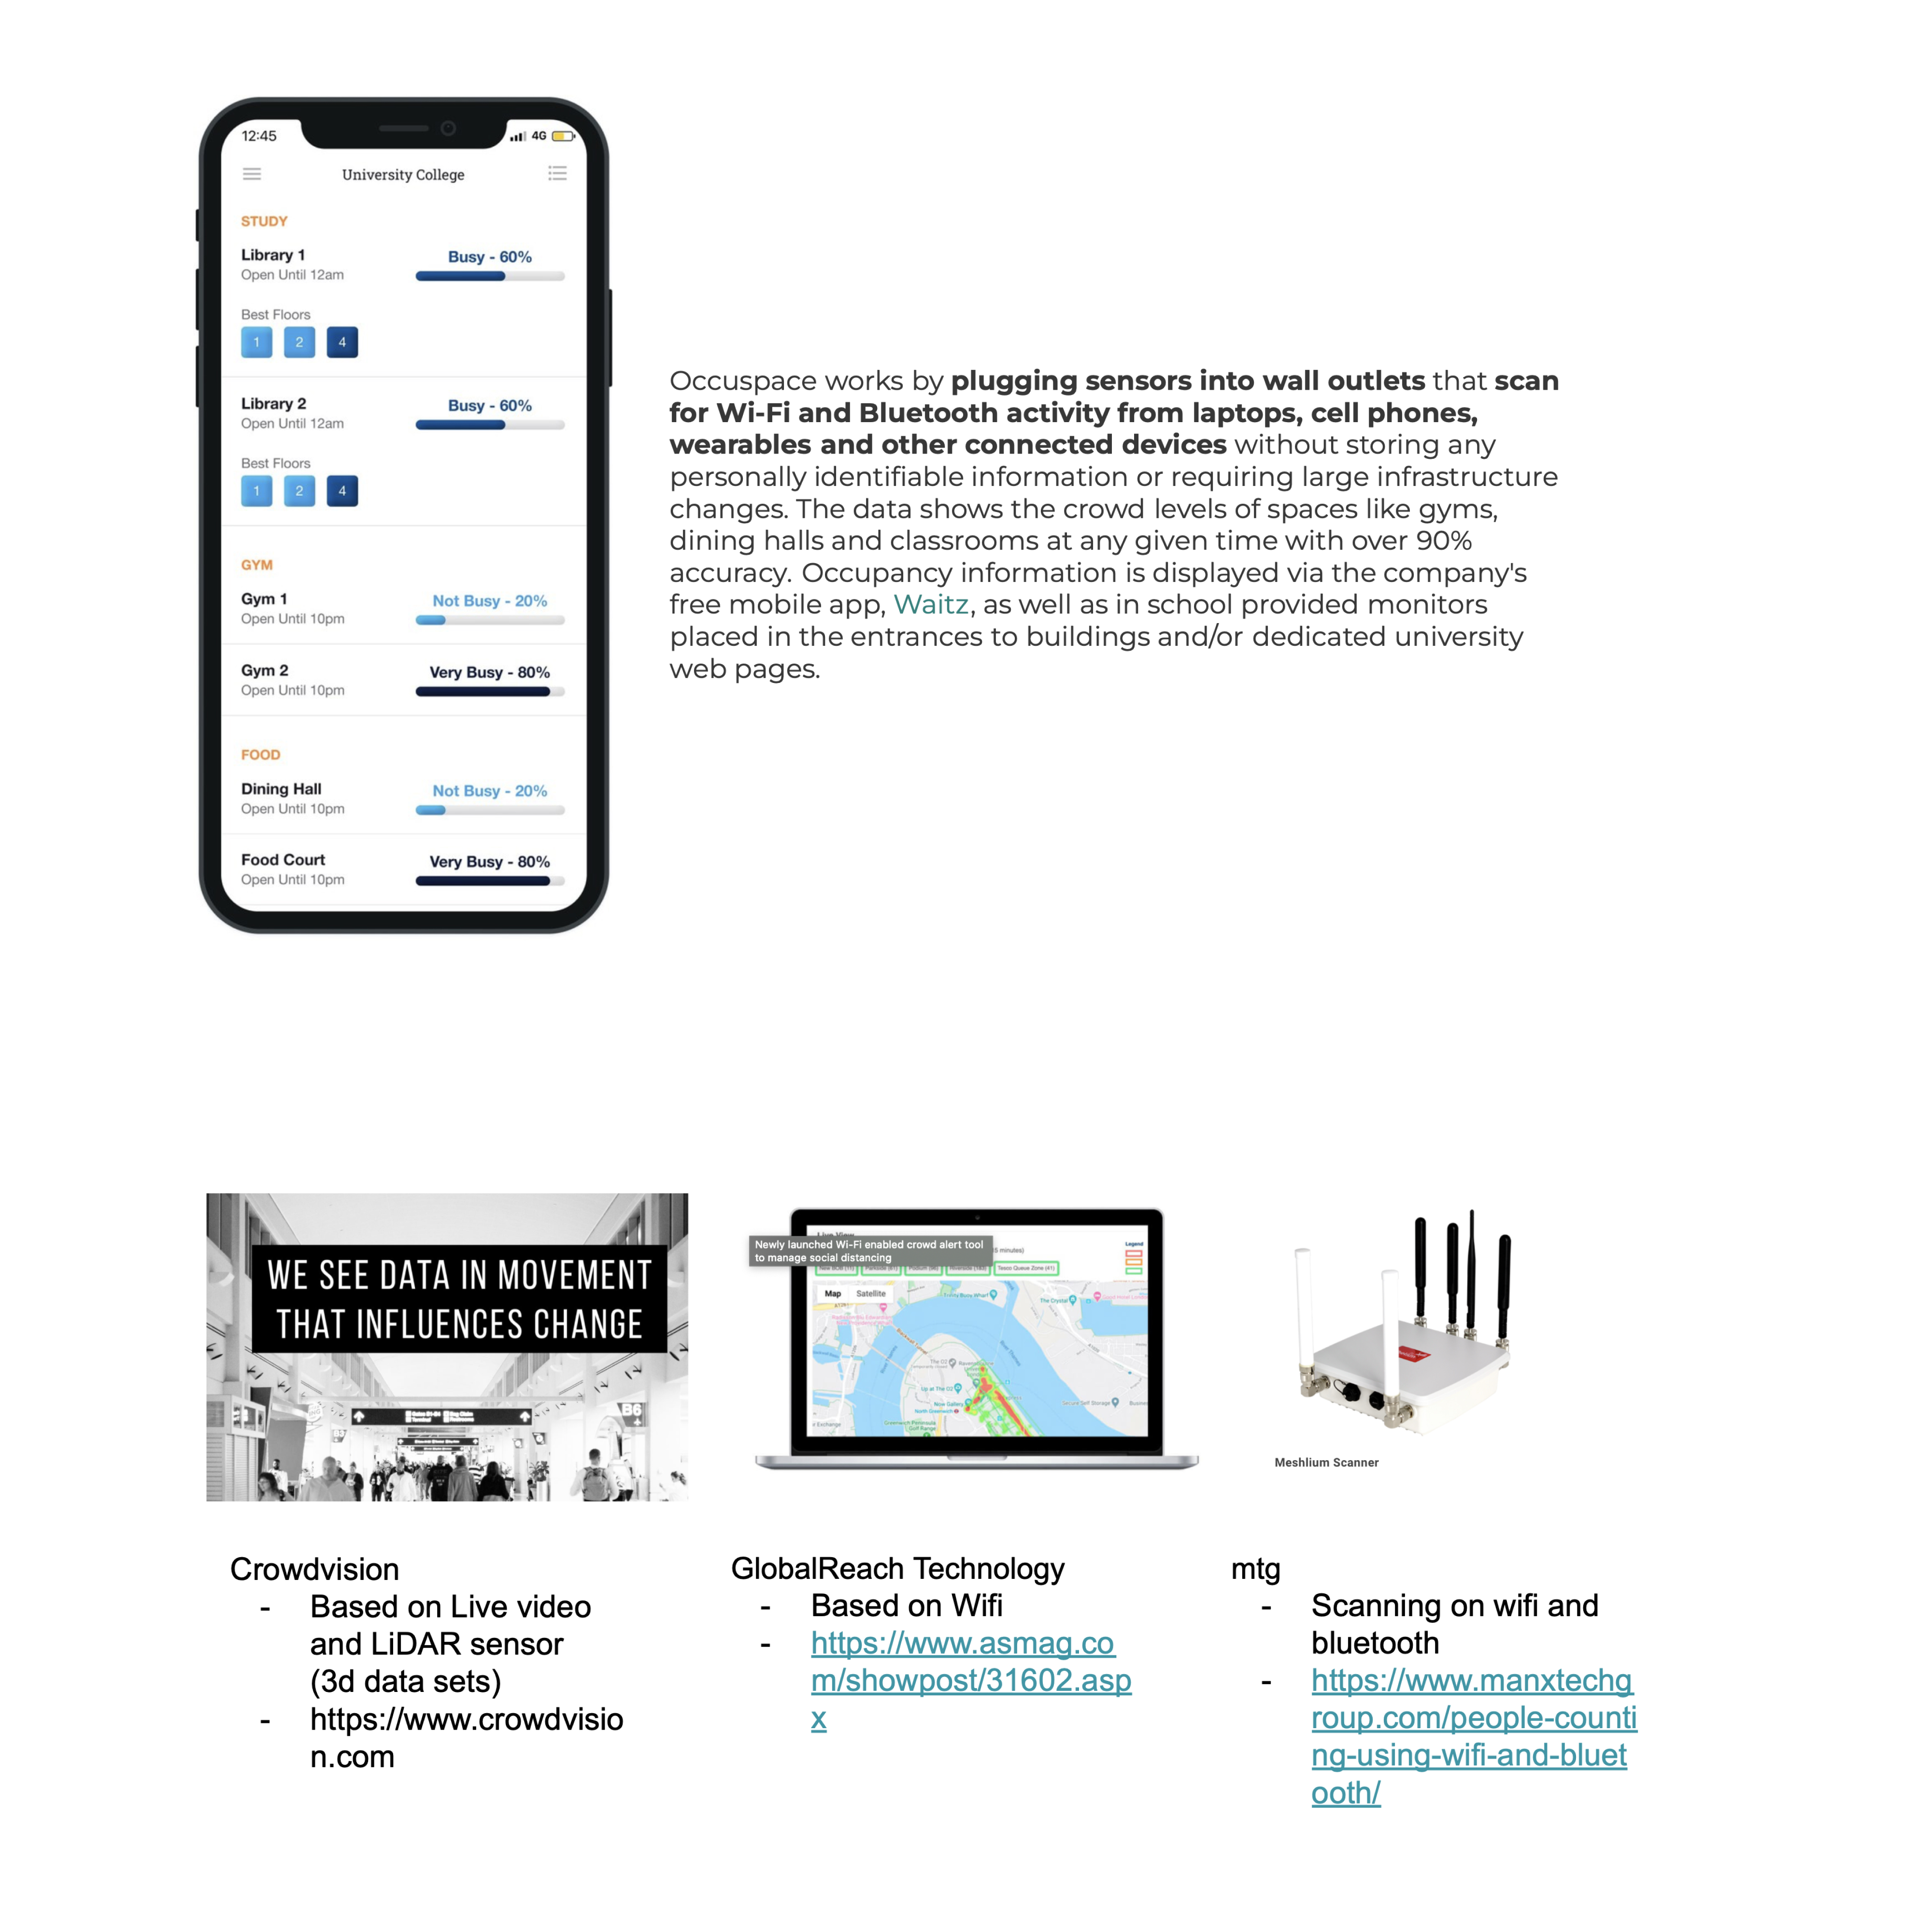
From the competitive audit, we were interested in the Google Map displaying the crowd density graph which is real time updated, so we searched for more existing technology that is similar to our preference, proving the possibility.
Ideate

UX Storyboard
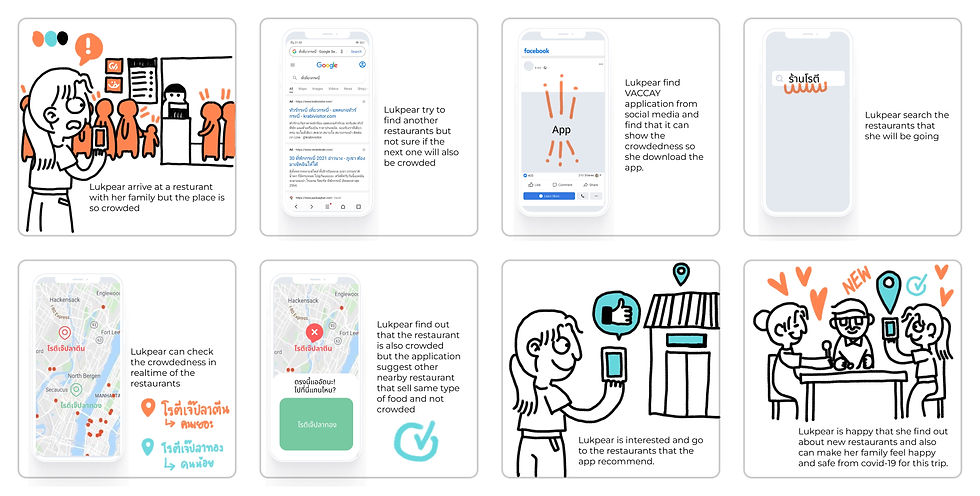
We collaborated on creating the UX storyboard to ensure everyone comprehends the functionality of the product and the user journey within it.
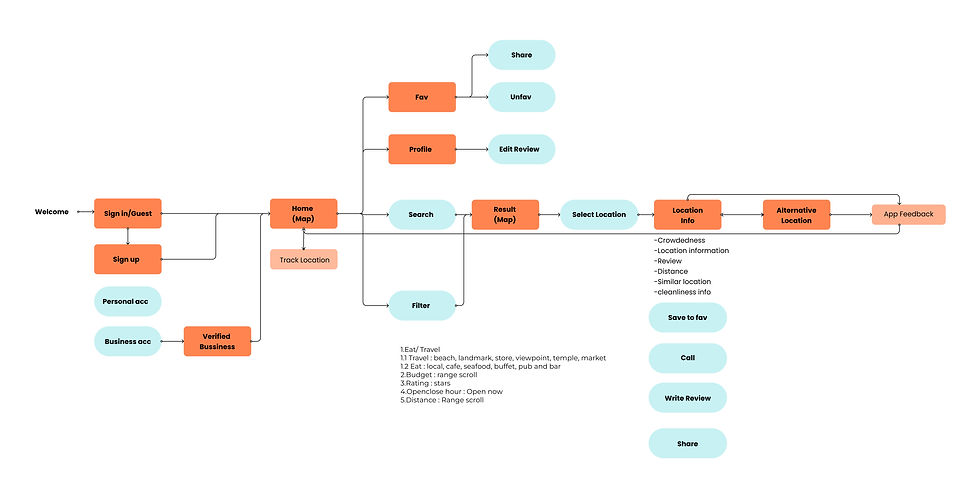
Sitemap
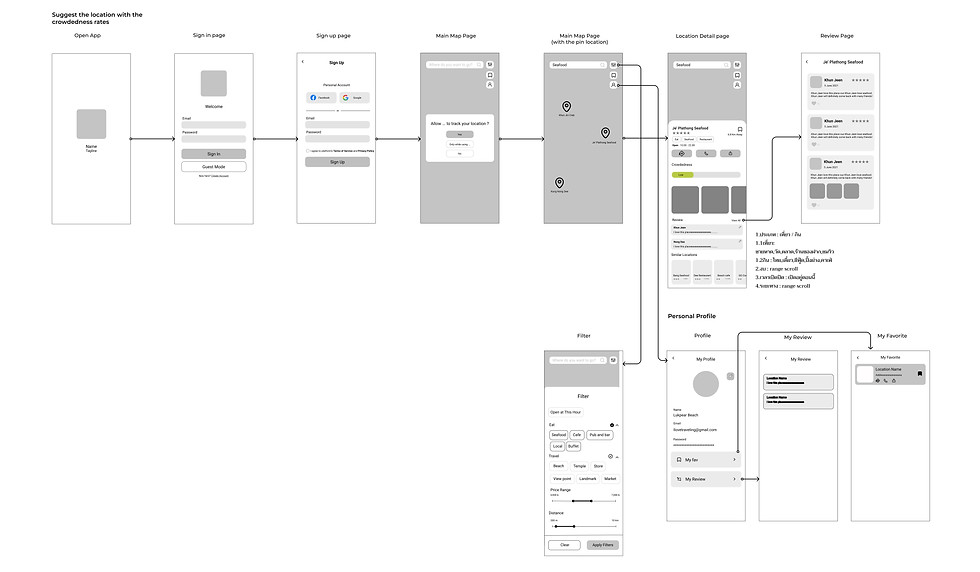
Wireframe
After we understood the flow from sitemap process, our wireframe is provided into three main flows:
1. Suggesting places with the crowdedness rate
2. Log in account to reach personal information in profile
3. Reviewing and commenting the location
Design
Identity
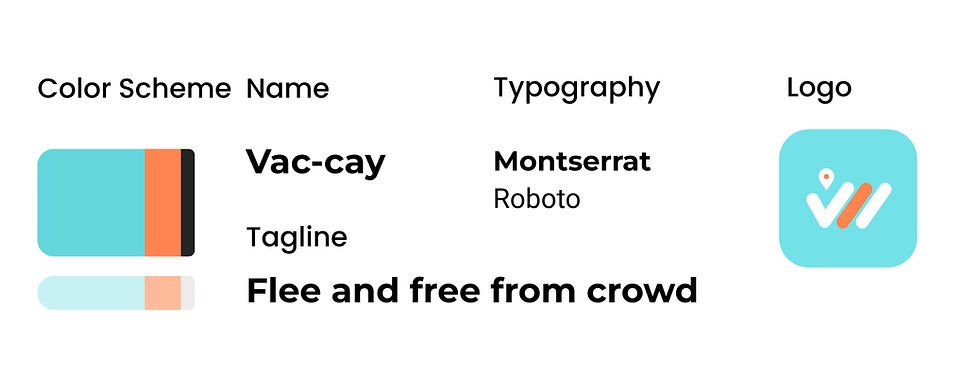
We decided to name our application as “VACCAY” which came from the short term of the word “Vacation”. Our tagline is “Flee and Free from Crowd” which directly means using our application the users can escape from the crowdedness. This phrase corresponds to our main feature.
The logo picked up, V, the capital letter from the name then made it similar to the check marksymbol meaning as it is ‘YES’ to go to this place then combined with the location icon. Moreover, the check marks are also inspired by people.
The main color of VACCAY is bright blue and orange colors which represent the sense of sea and the sunset from the Andaman ocean.

First Draft Hifi-Prototype
These hi-fi prototypes are for the initial round of the contest. After being informed that we advanced to the final round, we chose to develop the design of VACCAY’s user interface.
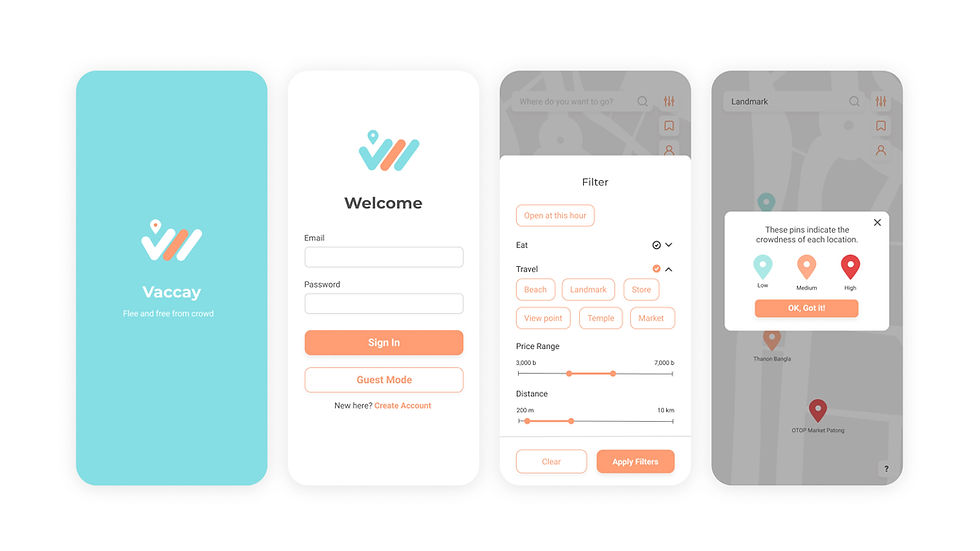
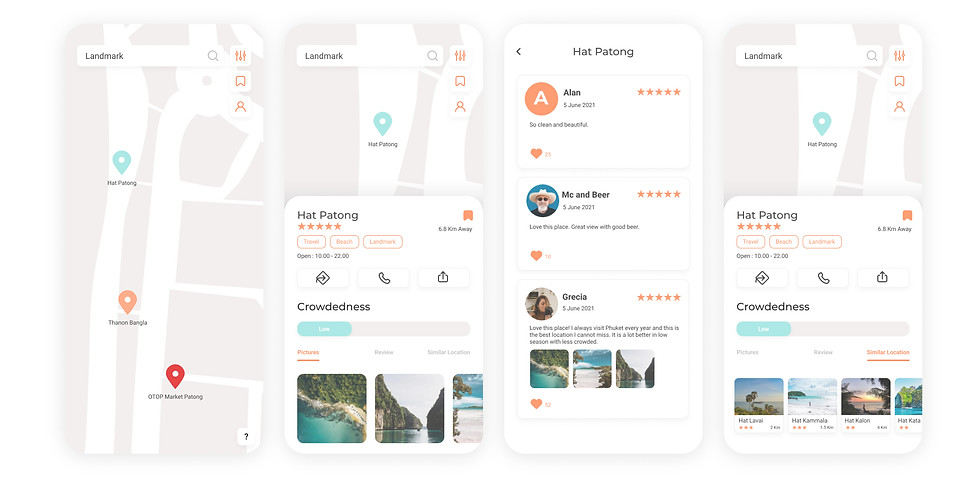
After the first round, we decided to develop our product interface according to our main purpose of the application, which is to inform the indicator of crowdedness and promote traveling, so we redesigned the onboarding page providing a short overview of VACCAY and showcased more beautiful pictures to promote the places.

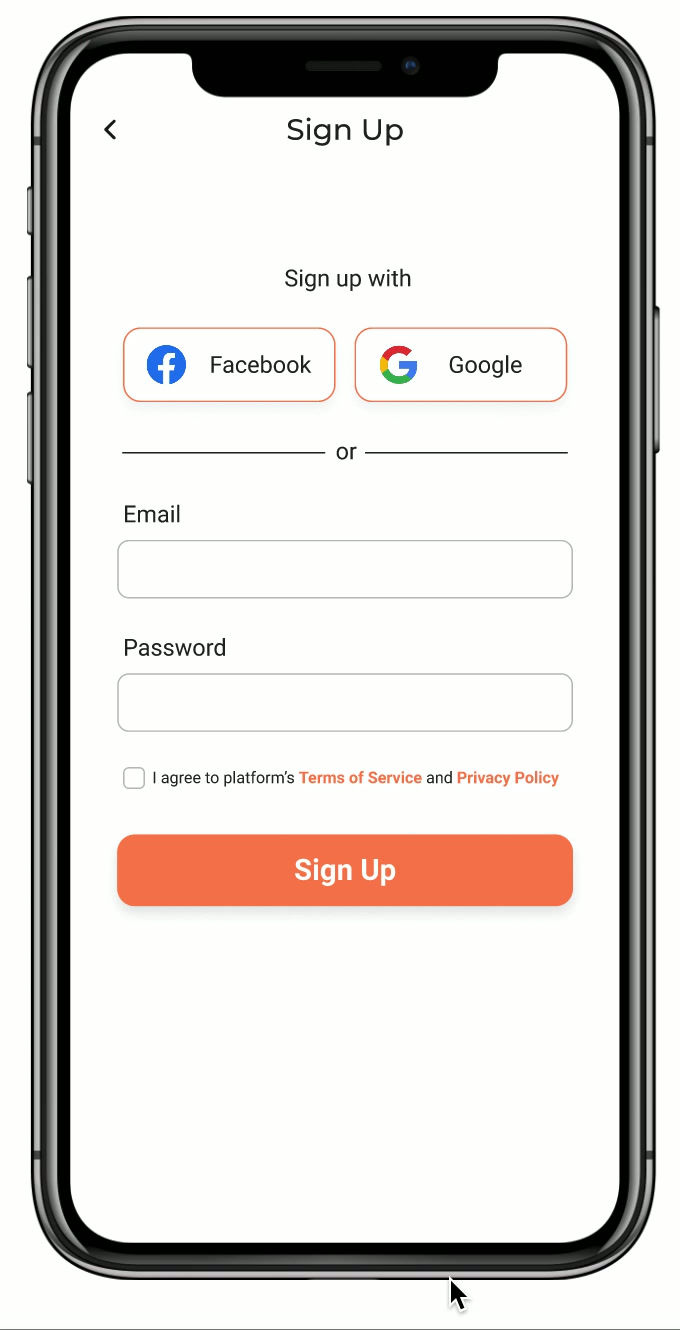
1. Getting into the application
Starting with the onboarding which presents the brief details of VACCAY, the user has a choice to log in by making an account or using the guest mode.
2. Suggesting the less crowded places via the home page
We decided to add the homepage instead of the map and bottom navigation bar, so the user can directly get the recommended places from nearby and it is easy to switch to other pages.
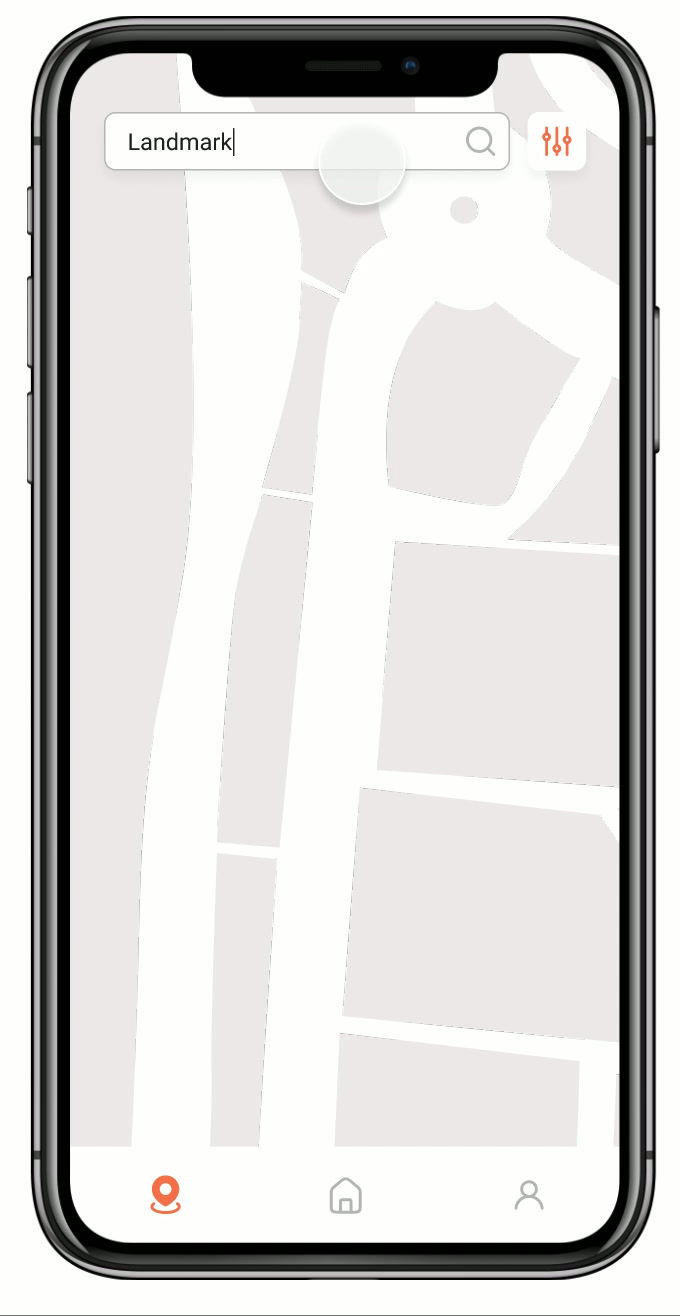
3. Showing the level of crowdedness by the pins
The main map page contains three colors of the pin which shows a different level of crowdedness. We redesigned the bottom popup to emphasize the crowded bar and bigger picture of the landmark.

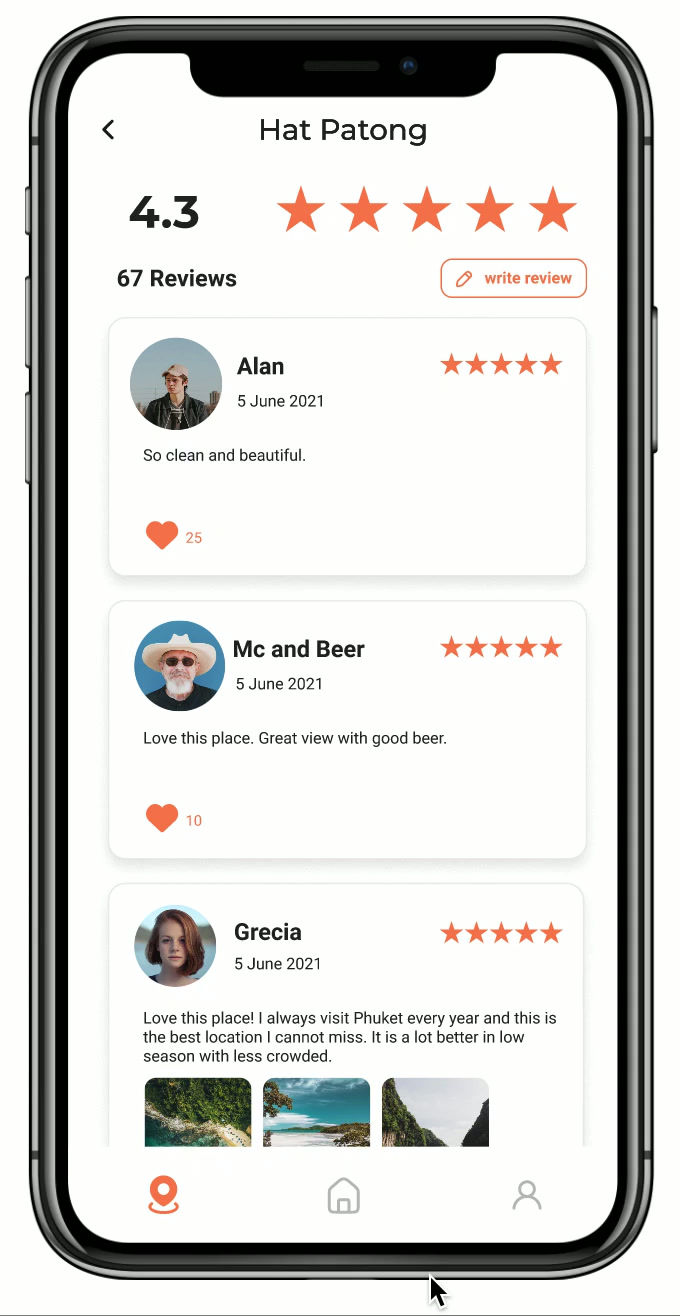
After sliding the bottom popup up, the user can find more information: the contact, direction, the alternative choice to go, and the insight information from others’ users by the review.
4. Seeing the similar locations and more information
Prototype
The user can share the review to help the others get to the place and also can save the interested destination to their list.
5. Knowing more about the destination by My Review and My Favorite
Test
Usability Test
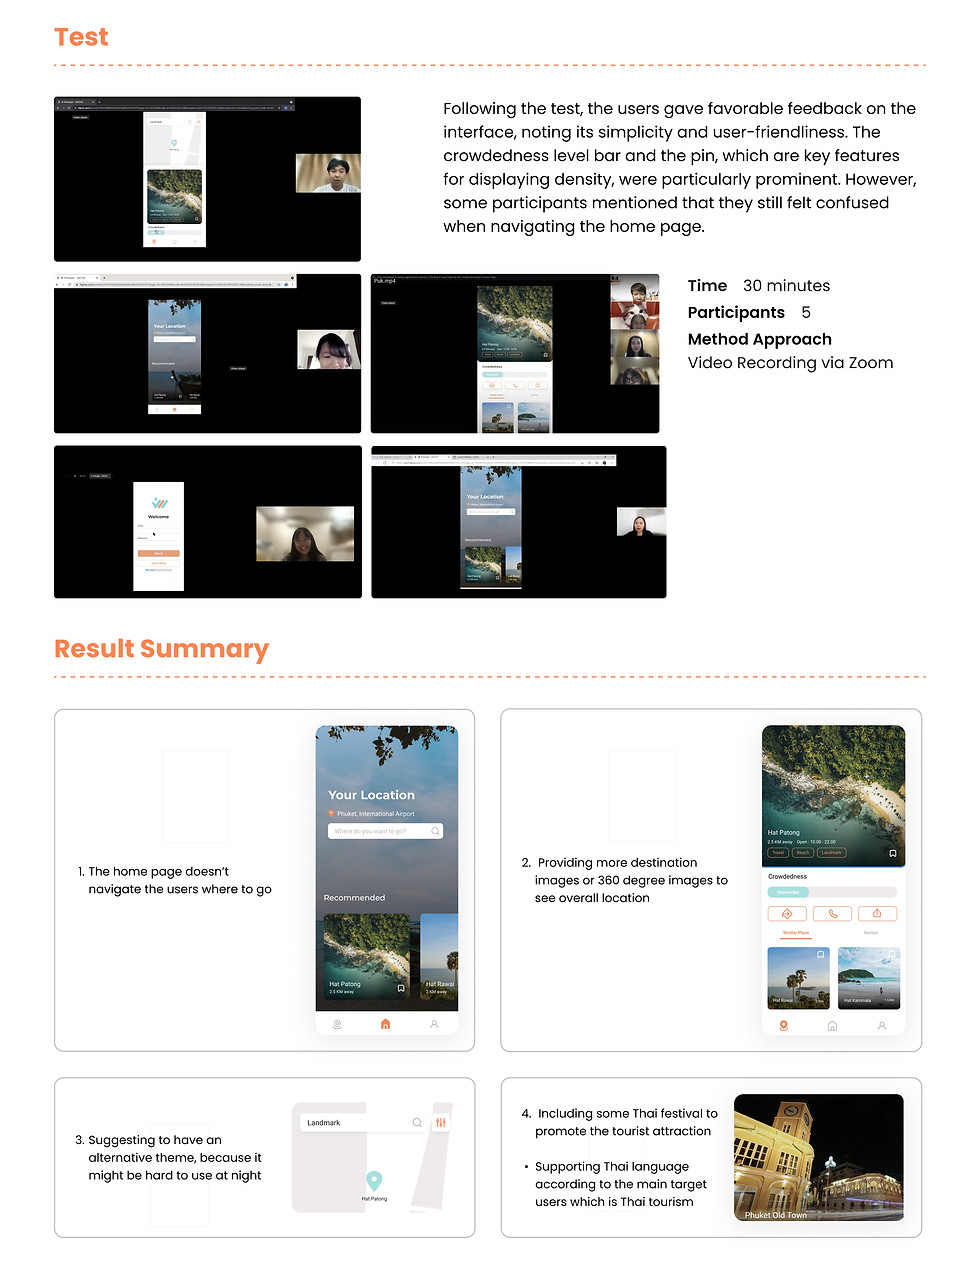
We chose to perform usability testing with five potential users to test whether the app delivers a positive experience and to determine if the crowdedness level indicator is easy to understand.
Aim
-
Assessing a good experience from users by using application
-
Testing the users’ understanding toward our level of crowdedness
-
Finding some suggestions from user
You are on vacation with your family. Now that you have arrived at Phuket airport then you have to plan the trip in which the destinations are less crowded.
Scenario
Reflection
1. Conducting user interview and consulting expert
Due to the limit of time, we did not do the user interview, which meant missing out the insight information and additional solutions based on real user experiences. After the contest, we also received feedback on the crowded detector. I consulted a friend from the engineering faculty. He acknowledged that while our concept was promising, it is difficult in terms of technology to deal with. This experience highlighted how important consulting with experts is.
2. Working on a team
Participating in a user experience innovation contest with friends was a new experience for me, and it provided a deeper understanding of the research and analysis process through different working styles. I could gain some advantages from collaborating by learning project management, compromising and respecting each others’ opinion, and enhancing my teamwork skills.